Creating Technology to Promote Learning
With one-click reports, easy-to-interpret results, and convenient exporting ability, the Benchmark Performance Levels reporting widget is a powerful tool helping to inform instruction and monitor student progress throughout the year. For a quick demonstration, check out the Galileo Tours video.
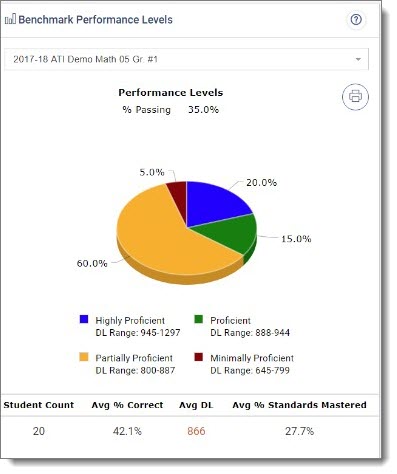
The Benchmark Performance Levels reporting widget allow users to quickly view assessment results
Accessible from the Galileo Teacher Dashboard, educators can view critical assessment results from an entire class via a colorful pie chart and interactive displays of data. Users can quickly view other assessment results including:
Need to export a report? No problem. Using the “Excel Export” button, educators can export Galileo reports to an Excel file making it easy to conduct further reports and analyses.
Schedule your personal demonstration today by contacting an ATI Field Services Coordinator, and don't miss the latest Galileo Tours video on the Benchmark Performance Levels reporting widget on our YouTube channel.
Read more Galileo technology announcements.
Connect with us!
email: GalileoInfo@ati-online.com
phone: 1.877.442.5453

